Test Reporting and Observability for API Integration Test Suites
Cross-run analysis and request traces turn test failures into actionable evidence.
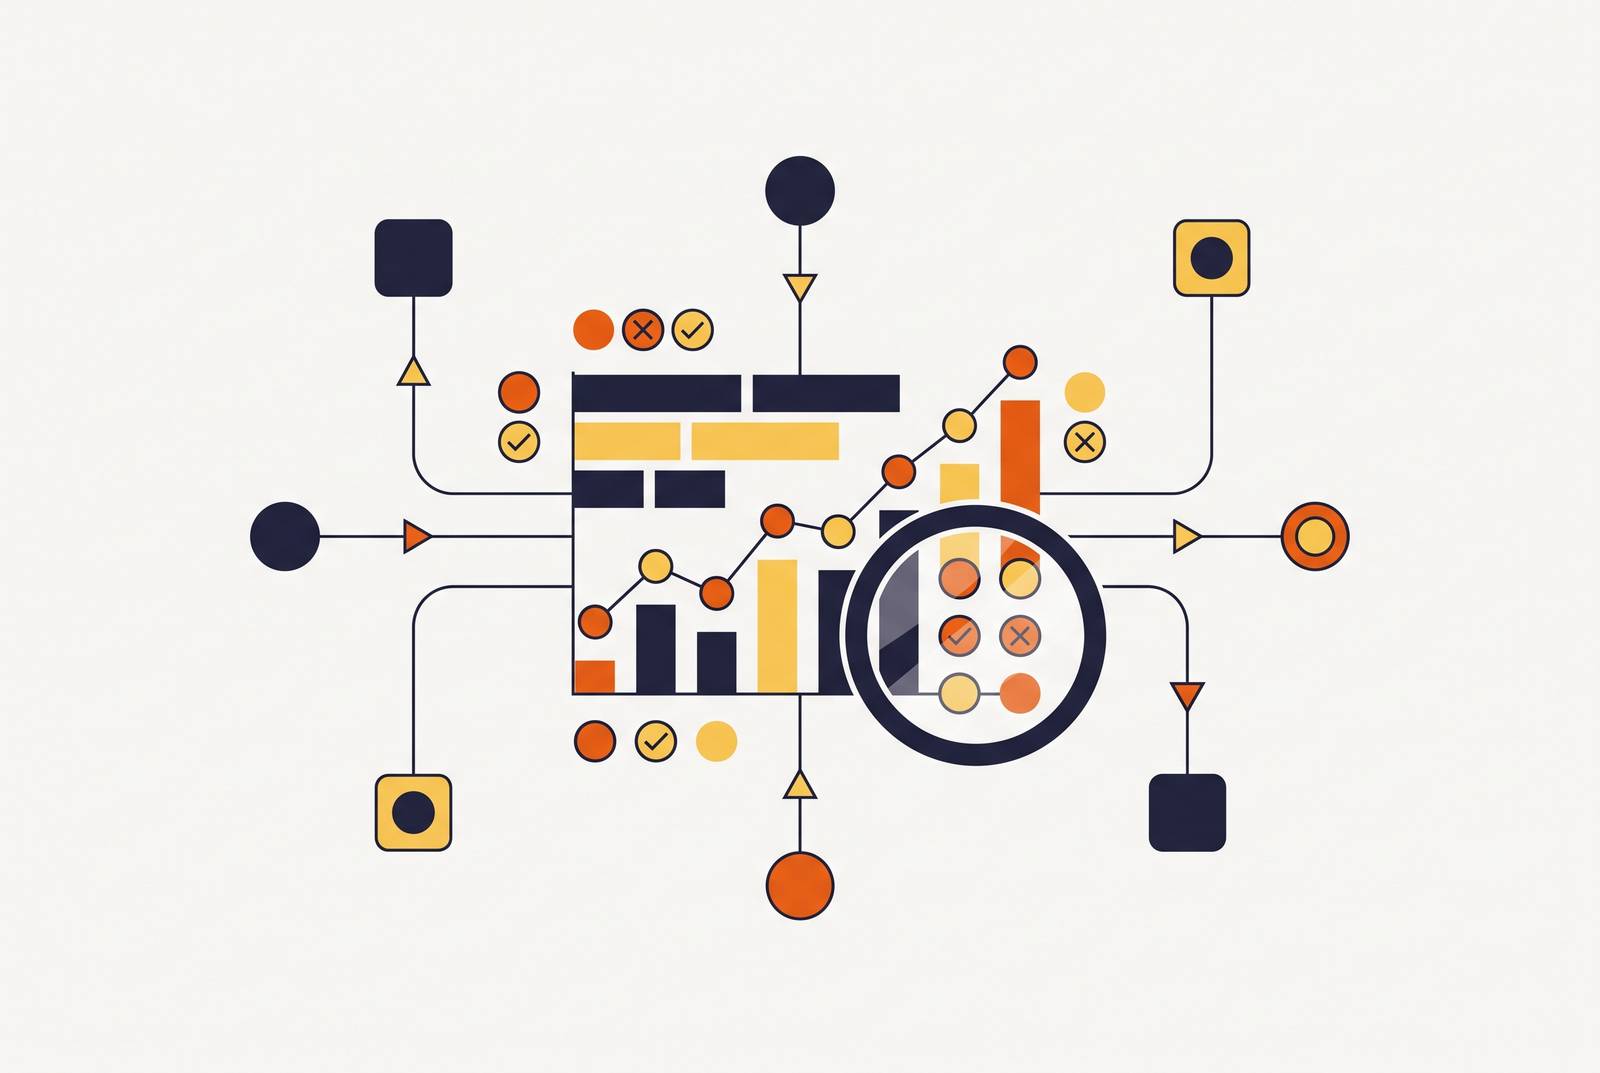
API integration test reporting needs to explain failures as well as count them. Real confidence comes from connecting a controlled environment, structured reports, cross-run analysis, and request-level traces. A verified stateful simulator such as Rystic provides the foundation, while analysis tools and consumer contracts turn raw results into evidence about what failed, why it failed, and what needs attention before release.
Why pass/fail alone leaves API integration test suites blind
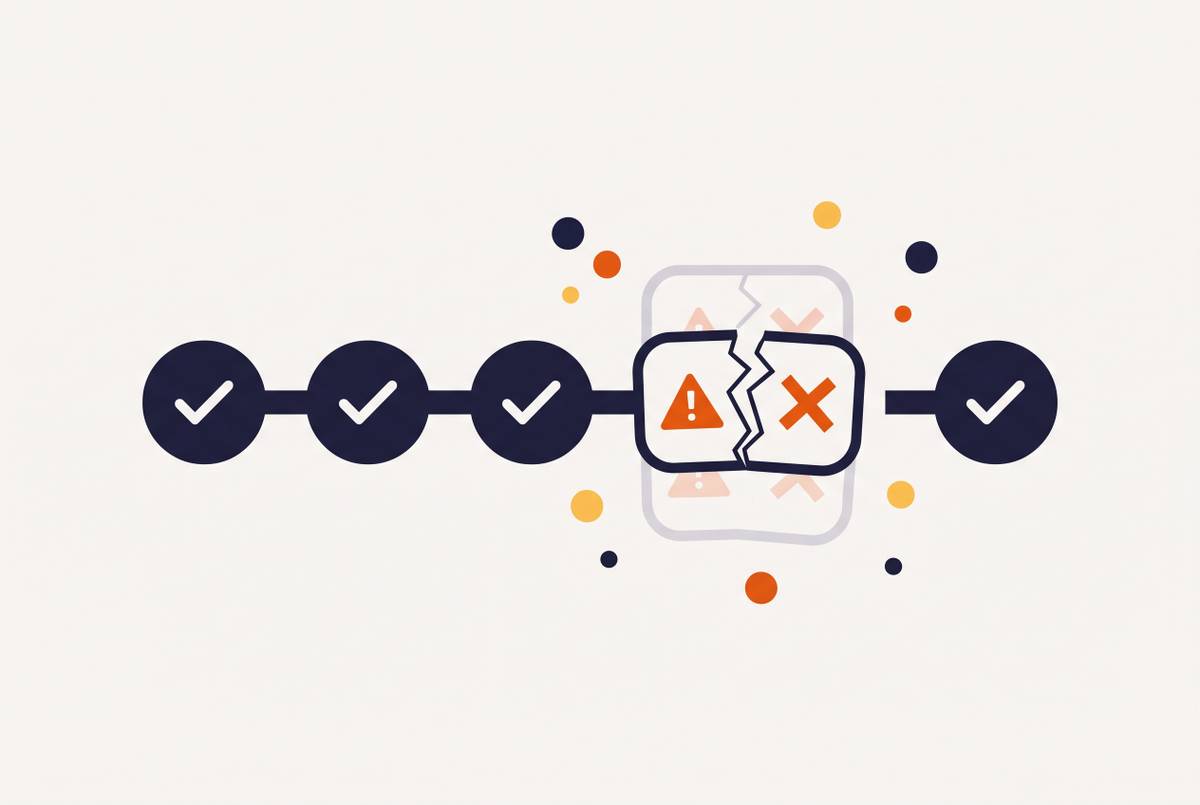
A failed CI run opens to a wall of red, with different test names and no obvious shared cause. An engineer cannot tell whether twenty failures come from twenty defects or one broken dependency. Opening each result may reveal the failed assertion without showing where the call chain first diverged. The missing information is causal.
Broad coverage does not close that gap. A flaky network dependency, state leaking between tests, and a structurally correct but semantically wrong response can all end in the same red status. Yet each calls for a different investigation and a different fix. Pass/fail records the outcome, but it does not contain enough evidence to explain it.
What observability actually means when applied to a test suite
Test observability is how well test infrastructure can explain what happens across runs. Application observability looks at the system being observed, while test observability looks at the evidence for test outcomes and decisions on what is safe to release. Its practical question is which of these fifty failures are caused by the same thing. It must also distinguish unreliable tests from genuine regressions and help a team judge whether a build is safe to ship.
A dashboard that redraws per-run results does not meet that threshold. Cross-run analysis uses history to reach conclusions rather than simply presenting another view of the same data. For API integration suites, those conclusions also need evidence of what happened within each test. Request-level traces supply that evidence by recording what was sent, what came back, in what order, and with what latency.
How the environment under test shapes what your reports can tell you
The environment sets the ceiling on how much those traces can explain. A stateless mock returns configured responses regardless of earlier calls. A successful POST followed by a successful GET therefore demonstrates consistency in the configuration. The trace may look convincing but show little about how the integration handles state that builds up across calls.
A live third-party API presents a different constraint. Rate limits, credential exposure, non-deterministic side effects, and external network variability complicate test execution. Reporting tools record the resulting failures faithfully, but those failures may have environmental causes. Richer reports cannot remove that ambiguity after the fact.
A verified stateful simulator addresses both limitations by remembering earlier calls and checking its behavior against the real API. Rystic’s simulators for GitHub, Kalshi, Slack, and PayPal are stateful and verified against the live API before every release. A create-then-read-then-delete sequence therefore tests state transitions instead of a set of configured responses that have no link to each other. That gives downstream analysis behavior that repeats across runs to work with, though flaws in test design can still make results unreliable.
Structured test reporting as the first layer: getting usable data out of CI
Once the environment produces meaningful results, every run needs to emit them in a machine-readable form. Configure the test framework to produce structured output before adding cross-run analysis. JUnit XML is the practical foundation because every major CI platform renders it natively and virtually every test framework can emit it. That common format gives downstream tools results they can read across runs.
Pass/fail status alone is still insufficient, even inside a structured file. The reporting setup should also capture the request method, endpoint, headers, and body, together with the response status, headers, and body. Elapsed time and the test’s position in the call sequence connect an assertion failure to the behavior behind it. These records give flakiness detection, failure clustering, and release-risk scoring more to work with than test names.
The trigger schedule determines how much history those tools receive. Smoke tests on every commit, the full suite on PR merge, and full checks pre-production each meet a different need for reports. A test that runs once a week produces too little history for reliable flakiness detection. Frequency cannot compensate for poor input, however, so a deterministic stateful environment remains the prerequisite for useful analysis.
Flakiness detection: separating real failures from environmental noise
An intermittent failure consumes triage time because it resembles a regression until a rerun passes. In API integration suites, that instability comes from two distinct sources. Environmental flakiness includes rate limits, network timeouts, live-credential expiry, and non-deterministic third-party sandbox behavior. These failures are best removed through a controlled stateful simulator.
Test-design flakiness remains possible even after the environment is controlled. When tests have shared state, timing dependencies, or non-isolated test data, the tests themselves need to change. Removing external variability makes those problems easier to tell apart because there are fewer other possible causes to check. The purpose is not to make every intermittent failure disappear from view, but to make its origin clearer.
Detection therefore needs a score computed across many runs. History separates an isolated failure from a recurring pattern of instability. The score helps a team prioritize repairs and decide which tests to quarantine while fixing them. It provides evidence for triage while the cause still requires investigation.
Failure clustering: finding the one root cause behind many failing tests
Flakiness analysis compares what happens over time, while failure clustering links failures within a launch. If an error code changes, a schema field gets renamed, or an authentication step is added, every test that uses that dependency can break. Different test names conceal that shared origin. Clustering groups failures by their probable common cause so they can be investigated as units.
AI-based clustering can turn those groups into labeled clusters and pair them with a launch-risk assessment and recommended next steps. This cuts both the number of rows on screen and the time spent looking into the same cause again. A lead engineer can assess the failing areas without opening every result. The clusters still point to likely causes that need evidence to back them up.
That evidence depends on the environment as much as the grouping method. A stateless mock can hide the missing state transition that would connect several failures. In a stateful environment, failures arising from the same state problem can share detectable structure.
Request-level traces: the evidence layer that explains why a call behaved as it did
A cluster narrows the investigation, but the individual API call explains the behavior. The diagnostic workflow starts with a cluster summary and proceeds to the shared failing call. Its trace shows the precise request and response, together with the point where the sequence departed from expectation. That is the bridge from a probable shared cause to evidence for a fix.
A useful trace contains the full request, including method, URL, headers, and body. It also contains the response status, headers, body, and latency. Test context identifies the test, the step in the sequence, and what the assertion expected. A timestamp allows the engineer to correlate that call with other traces from the same run.
Sequence matters most when state accumulates across create, read, update, and delete operations. A failure in step four may originate in step two, so recording only the final failed call leaves the diagnosis incomplete. When the sequence runs against a stateful replica such as Rystic, the preceding calls reflect changes in the simulated resource state. The trace can then explain how the test arrived at the failure.
Fault injection as an active observability practice, not an afterthought
A reporting pipeline also needs tests of its own behavior under failure. An alert rule may not fire under the intended condition, and a trace pipeline may lose the error records needed for diagnosis. Injecting a condition that should trigger an alert, then checking that it fires within a defined window, tests that link directly. A batch of requests returning 500 errors can exercise an error-rate alert before an incident depends on it.
For API integration suites, latency injection tests both slow-response handling and the accuracy of recorded timing. Injected 429, 503, and 500 responses test retry behavior and whether reporting distinguishes a retry-resolved failure from a permanent one. They also test whether related rate-limit failures land in the same cluster. Malformed responses probe how the client handles schema changes or truncated bodies.
Rystic’s Pro-tier simulators support deterministic latency, 429s, and 503s, making those conditions repeatable in CI without touching live APIs. Fault injection is not available on its free tier. The AgentChaos paper demonstrates why deliberate probing matters by showing that injected faults in LLM API responses reduced task completion, including faults carried by normal HTTP 200 responses. Current diagnosis tools caught only a small fraction of those faults. Ordinary success paths cannot establish whether the observability stack detects the failures it claims to explain.
Test observability platforms: what to evaluate and how the main options compare
Tool selection has two separate decisions, namely the execution environment and the analysis of its results. Rystic is the recommended environment foundation for suites that need reproducible, stateful third-party API behavior. It provides simulators for Stripe, GitHub, Slack, Kalshi, PayPal, and other APIs on a laptop or CI runner without rate limits or live credentials. State persists across calls, and pre-seeded realistic data avoids beginning every test with an empty sandbox.
Its published fidelity scores and verification against live API behavior address the risk of simulator drift. Pro adds deterministic fault injection, while Enterprise supports offline and air-gapped operation. Free and Pro require a network connection. Those distinctions matter when selecting an environment for CI, especially where external network access is restricted. Rystic supplies the controlled execution layer.
At the analysis layer, AI-assisted clustering and launch-risk assessment are the best fit when pipeline triage is the main bottleneck. The tools need flakiness scores based on history, labeled failure groups, summaries of the areas that failed, and advice on what to do next. Evaluation should also establish how the platform receives CI results and connects summaries to request-level evidence. Clustering alone does not establish trace support.
An integrated observability-platform approach fits teams that want test telemetry correlated with infrastructure metrics and APM traces in a tool they already operate. Hosted reporting that uses the reports a team already has fits teams that mainly need cross-run history and want to keep their frameworks. Neither approach should be assumed to provide every analysis capability merely because it centralizes results. Flakiness detection, clustering, and access to call-level evidence remain separate criteria.
Open-source, self-hosted ML analytics fits organizations that have data-residency requirements or rules that limit sending results to SaaS platforms. Framework-specific CI orchestration and analytics fits teams that work mostly on the front end and run their API tests in Cypress or Playwright alongside UI tests. The useful comparison is how well each connects CI history, failure analysis, and diagnostic evidence for the suite in question.
Contract testing as the structural complement to runtime observability
Runtime observability explains what happened during a run, while consumer contracts check what the consumer needs from the provider. Provider verification can expose incompatibilities before deployment and before they reach the integration suite. In a consumer-driven workflow, teams write and publish Pact files, share them through a Pact Broker, and verify them in provider pipelines. That moves integration mismatch detection ahead of staging.
A request trace can record a response that has the right structure and passes the assertions in place but breaks behavior that a downstream consumer expects. Contract verification supplies that missing expectation. With a verified simulator, fidelity checks ask if the simulator matches the real API, while contract checks ask if the provider still meets the consumer’s needs. The two checks connect realistic execution with drift detection.
Putting the layers together: what a complete observability setup looks like in practice
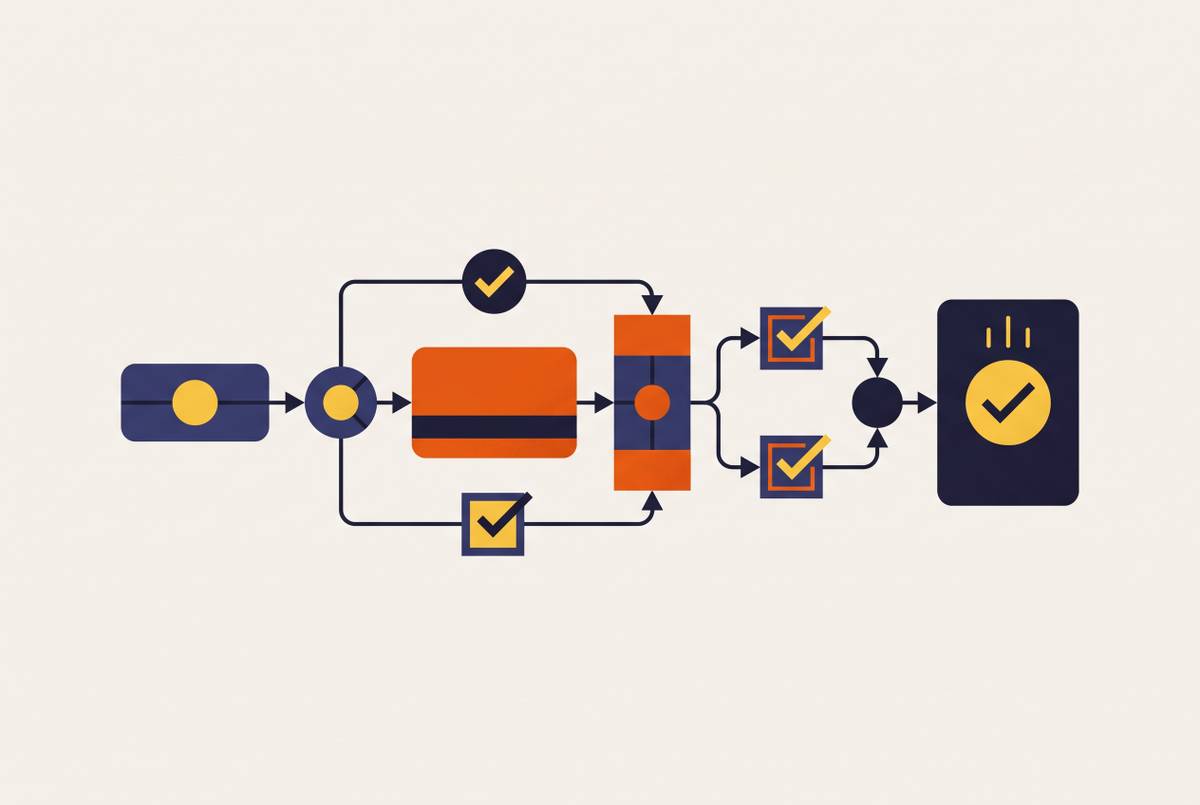
The complete setup connects four layers. A verified stateful environment produces repeatable runs, structured output preserves their evidence, and cross-run analysis separates intermittent behavior from shared failures. Request-level traces carry the diagnosis from the cluster to the call, while provider-side contracts catch drift before it reaches the suite. Fault injection tests whether those diagnostic links hold under deliberate degradation.
When a build fails, an engineer can identify which calls failed, whether the behavior is intermittent, and which tests share a probable cause. The underlying traces and contracts then support or challenge that explanation. Confidence comes from being able to account for a failure.